Store Cannibalization
Every retail company look for strategic positions to attract the right customers and maximize sales. Location is crucial for any type of business. By incorporating spatial analysis, retailers can gain valuable insights into customer demographics, competitor proximity, foot traffic patterns, and market dynamics. This allows them to identify ideal locations for their stores and build an optimized network.
However, if the spatial component is not considered since the first steps of territory occupation, the store network might not be as well structured as desired, for one of the challenges a retailer might face in a developed network is store cannibalization. It occurs when stores (from the same retailer) are located within close proximity to each other, which leads to a redistribution of sales rather than overall sales growth.
To avoid cannibalization, it is important to evaluate the spatial market in areas where growth is intended. This involves considering customer behaviour from existing stores and looking for vacant spaces, in order to strike a balance between expanding the network and maintaining the performance of the existing stores. However, if this was not considered initially, the network should be analysed to determine if cannibalization exists.
GIS (Geographic Information System) tools make it easy to study such phenomena, ranging from a simple analysis of store catchment areas to a more complex analysis that takes into account customer behaviour and the types of products purchased from the analysed stores. In this article, a simple study will be conducted to demonstrate store cannibalization by analysing the catchment areas of Carrefour supermarkets in Madrid.
Practical example of cannibalized areas
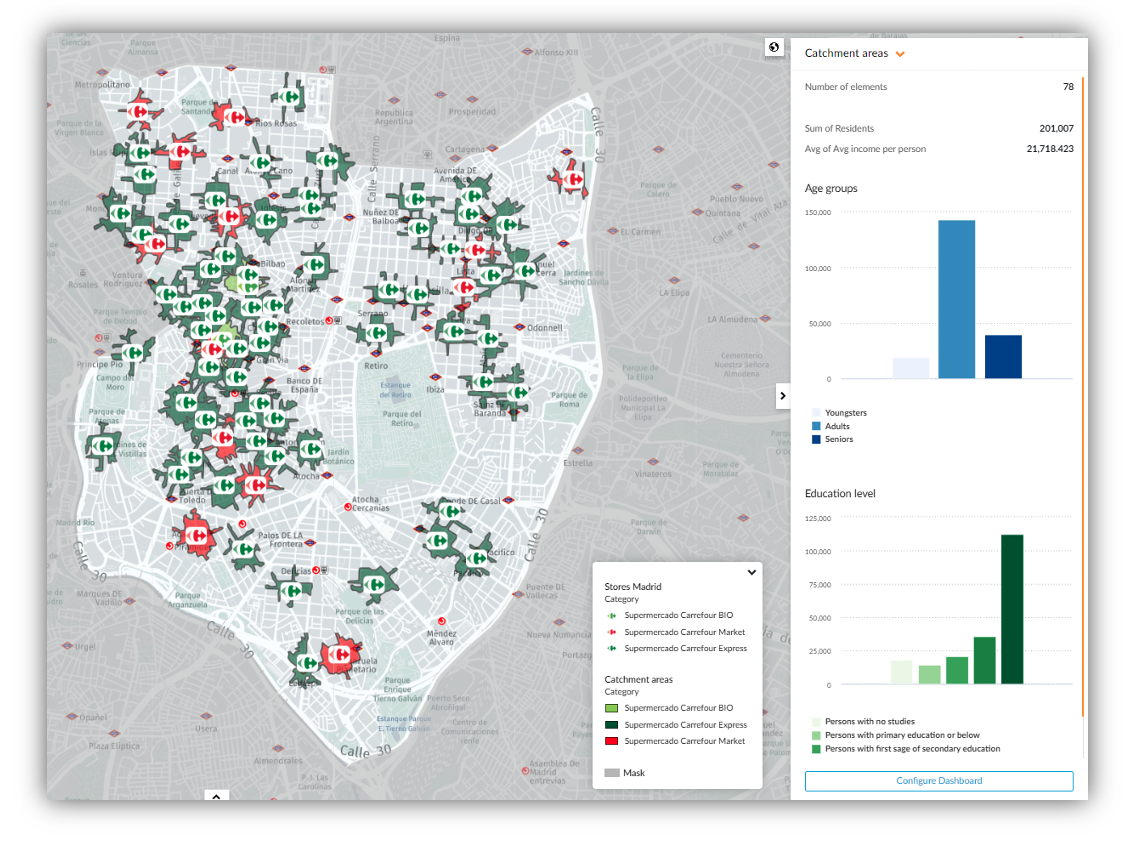
Carrefour has a significantly developed network in Spain, with more than 1.700 stores. For the purpose of this analysis, we will focus on a specific area in the city of Madrid that comprises 78 stores (image below). Among these stores, the majority (65) are convenience stores, specializing in day-to-day products. Within this category, there are 2 Bio supermarkets that offer specific products. The remaining 13 stores are Carrefour Market, larger in size and offering a wider range of products. These Carrefour Market stores tend to attract customers from a greater distance.

Madrid - Study area
Ideally, the distinction between "Express" and "Market" would result in different catchment areas, as proximity stores (Express) would primarily serve customers in close proximity, while larger supermarkets (Market) would attract customers from farther distances due to their size and product offerings. This concept aligns with the Huff gravity model, which states that the likelihood of a consumer visiting and making a purchase at a specific store depends on the distance to that store, its attractiveness, and the distance and attractiveness of competing stores (Huff, 1963). To simplify this analysis, we will consider all stores to be equally attractive. Therefore, catchment areas were created based on a 5-minute walking distance for each store, as seen in the image below.
5 minutes catchment areas
Based on the generated catchment areas, it is possible to obtain demographic information about the stores, which is visible on the dashboard in the image above. In total, the Carrefour network serves a population of 201.000 residents, with an average income per person of €21.718. Among them, 71% are adults, between the ages of 16 and 64. Moving on to the analysis, the objective is to determine the number of residents among the 201.000 who are within a 5-minute walking distance of more than one store. These areas represent the overlapping regions where store cannibalization occurs.
It is evident from the catchment areas on the map that there are areas of overlap, which can be delimited to obtain the desired details. There are 50 situations of overlapping, involving 30 different stores, where approximately 30k residents are living. This accounts for approximately 15% of the residents within a 5-minute walking distance of the stores, who have the option to easily access more than one store. This overlapping situation has the potential to result in a redistribution of sales among the stores involved.
Looking at the map below, which displays the distribution of residents in the overlapping areas, it is possible to observe the concentration of this phenomenon, where possibly the network is less efficiently structured, and how the residents are distributed in those areas, allowing to have an overview of the carrefour network situation.

Overlapping areas
An analysis of each store individually can be conducted to determine whether actions should be taken to avoid cannibalization. Let's examine the situation between Carrefour Calle Toledo Madrid (Store 1) and Carrefour Calle Humilladero (Store 2), both of which are “Express” stores. The catchment areas of both stores overlap by 43%, as indicated by the red areas on the map, while the green areas represent the overall catchment areas.

Overlapping areas - Example
This overlapping area is one of the most significant in terms of population within the studied area, with 1.768 residents living within a 5-minute walking distance of both stores. This number accounts for 45% of the total residents in the catchment area of Store 1 and 46% of the catchment area of Store 2. It is a considerable portion for both stores. Based on this information alone, the retailer should consider implementing solutions to prevent the sharing of customers between these two stores. One possible solution could involve closing one of the stores and relocating it to a different area, or converting it into a different type of store, such as a bio store, to appeal to different market segments and reduce cannibalization.
By taking such actions, the retailer can optimize their store network and ensure that each location effectively serves its intended catchment area, maximizing sales potential and minimizing cannibalization between stores.
As mentioned before, this was a simplified analysis of cannibalization, with the goal of demonstrate how practical the process can be using location analytic tools. In real-world scenarios, a more comprehensive and detailed analysis would be conducted, considering, for example, customers location to accurately define catchment areas and to evaluate whether cannibalization is occurring.
Bibliography
Huff, David L. (1963). "A Probabilistic Analysis of Shopping Center Trade Areas". Land Economics. 39 (1): 81–90. doi:10.2307/3144521. ISSN 0023-7639. JSTOR 3144521.