
Utilities Need More Than Infrastructure Maps
TL;DR: Utilities have always been geographical businesses. However, as the sector moves from protected markets, fixed concession logic and captive customers towards greater competition, distributed resources and higher service expectations, geography must support more than engineering and operations. It must become an accessible business dimension for strategy, investment, sales, marketing, customer service and service quality.
Utilities are among the most geographical businesses in the economy. Power plants, transmission lines, substations, pipelines, reservoirs, treatment facilities, service points and customers all occupy a specific place. Demand varies between territories. Infrastructure risks are local. Service obligations are geographically defined. Even national investment plans ultimately become decisions about particular regions, cities and neighbourhoods.
Most utilities already recognise this at an infrastructure level. They have sophisticated GIS platforms, network models and operational systems that help specialist teams design, document, maintain and operate physical assets. The larger opportunity is to make geography useful beyond those specialist environments.
A strategy manager should be able to compare demand, infrastructure and market evolution across territories. A commercial team should understand where different customer profiles and opportunities are concentrated. Customer service should recognise geographical patterns in complaints and interruptions. Marketing should adapt propositions and channels to local market conditions. Investment teams should evaluate where CAPEX can produce the greatest operational, regulatory, social and commercial value.
This does not require every employee to become a GIS specialist. It requires geographical data and analytical capabilities to become accessible to the people making business decisions.
From captive customers to markets that must be understood
For much of their history, many utilities operated within a relatively stable model: regulated monopolies or concessions, fixed service territories, predictable infrastructure responsibilities and customers with little or no choice of supplier.
The organisation’s priorities naturally reflected that model. The focus was on engineering, network reliability, regulatory compliance, capacity planning and the efficient delivery of an essential service. Customers were often treated primarily as connection points, meters, contracts or billing accounts rather than as different segments with distinct needs, behaviours and expectations. That environment is changing.
Liberalisation is introducing competition into parts of the value chain. New energy retailers and digital channels are changing how services are sold. Distributed generation, batteries and electric vehicles are turning passive consumers into more active participants in the energy system. Regulators and customers increasingly expect transparency, responsiveness, sustainability and a better service experience.
Brazil’s electricity market provides a clear example. Since 2024, every high-voltage consumer has been able to access the free electricity market. In April 2026, another 1,213 consumers migrated, with approximately 75% entering through retail agents that simplify market access, according to the Brazilian Chamber of Electric Energy Commercialisation.
The reform enacted in 2025 also established a path for extending market access to low-voltage consumers, subject to the necessary regulatory arrangements and consumer protections defined in Brazilian Law 15,269/2025. This is not simply a regulatory or commercial adjustment. It requires a significant change in mindset.
In a captive market, knowing the infrastructure and aggregate demand may be sufficient for many decisions. In a competitive market, a company also needs to understand who its current and potential customers are, where relevant segments are concentrated, which territories are changing, how competitors and alternative solutions are positioned, and which propositions and channels are likely to work in each market.
Customer orientation cannot be achieved only through a new CRM, a digital campaign or a customer-experience programme. It depends on connecting operational knowledge with a much richer understanding of customers and the territories in which they live and operate.
Core operational GIS is essential, but it is not the whole answer
Utilities already invest substantially in geospatial and infrastructure-management technology. Platforms such as GE Vernova Smallworld, IQGeo Network Manager, Esri ArcGIS Utility Network, Hexagon’s network-management portfolio and Bentley OpenUtilities provide powerful capabilities for modelling network connectivity, maintaining asset records, supporting design and construction, coordinating field work and managing operational workflows.
These platforms can be core systems of record for a utility. Their depth and specialist capabilities are indispensable when accuracy, connectivity and asset lifecycle management are involved.
However, their primary purpose is usually to represent and operate the network. They are not necessarily designed, by themselves, to satisfy every analytical data need across strategy, finance, commercial management, marketing, customer experience, regulation and sustainability.
A network GIS may show every transformer, pipe or valve with great precision while still providing little direct insight into the socioeconomic profile of the surrounding population, the commercial activity of local businesses, changes in customer demand, competitive presence, mobility patterns, urban development or the exposure of communities to climate risk. This is not a limitation of the operational GIS. It is a different analytical requirement.
The opportunity is to preserve these systems as authoritative operational foundations while making selected network information available within a broader, business-oriented Geographical Intelligence layer.
Geography connects what organisational systems separate
A utility may have valuable information in its GIS, billing platform, CRM, SCADA environment, asset-management system, call centre, work-management application, metering infrastructure and financial systems. The difficulty is that many important decisions require information from several of these systems at the same time.
Consider an area experiencing repeated service interruptions. The network team sees affected assets and technical events. Customer service sees complaints and contact volumes. The regulatory team monitors continuity indicators. Commercial teams may see valuable customers at risk. Investment planning evaluates the cost and benefit of reinforcing the infrastructure.
These are different views of the same geographical reality. Location provides a common reference through which they can be connected. Once brought together geographically, the organisation can understand not only what happened, but where it happened, which customers and activities were affected, what other risks are present and where action should be prioritised.
The objective is not to create a single enormous map containing everything. It is to create a governed geographical foundation that different departments can use to answer their own questions.
From nationwide coverage to street-level intelligence
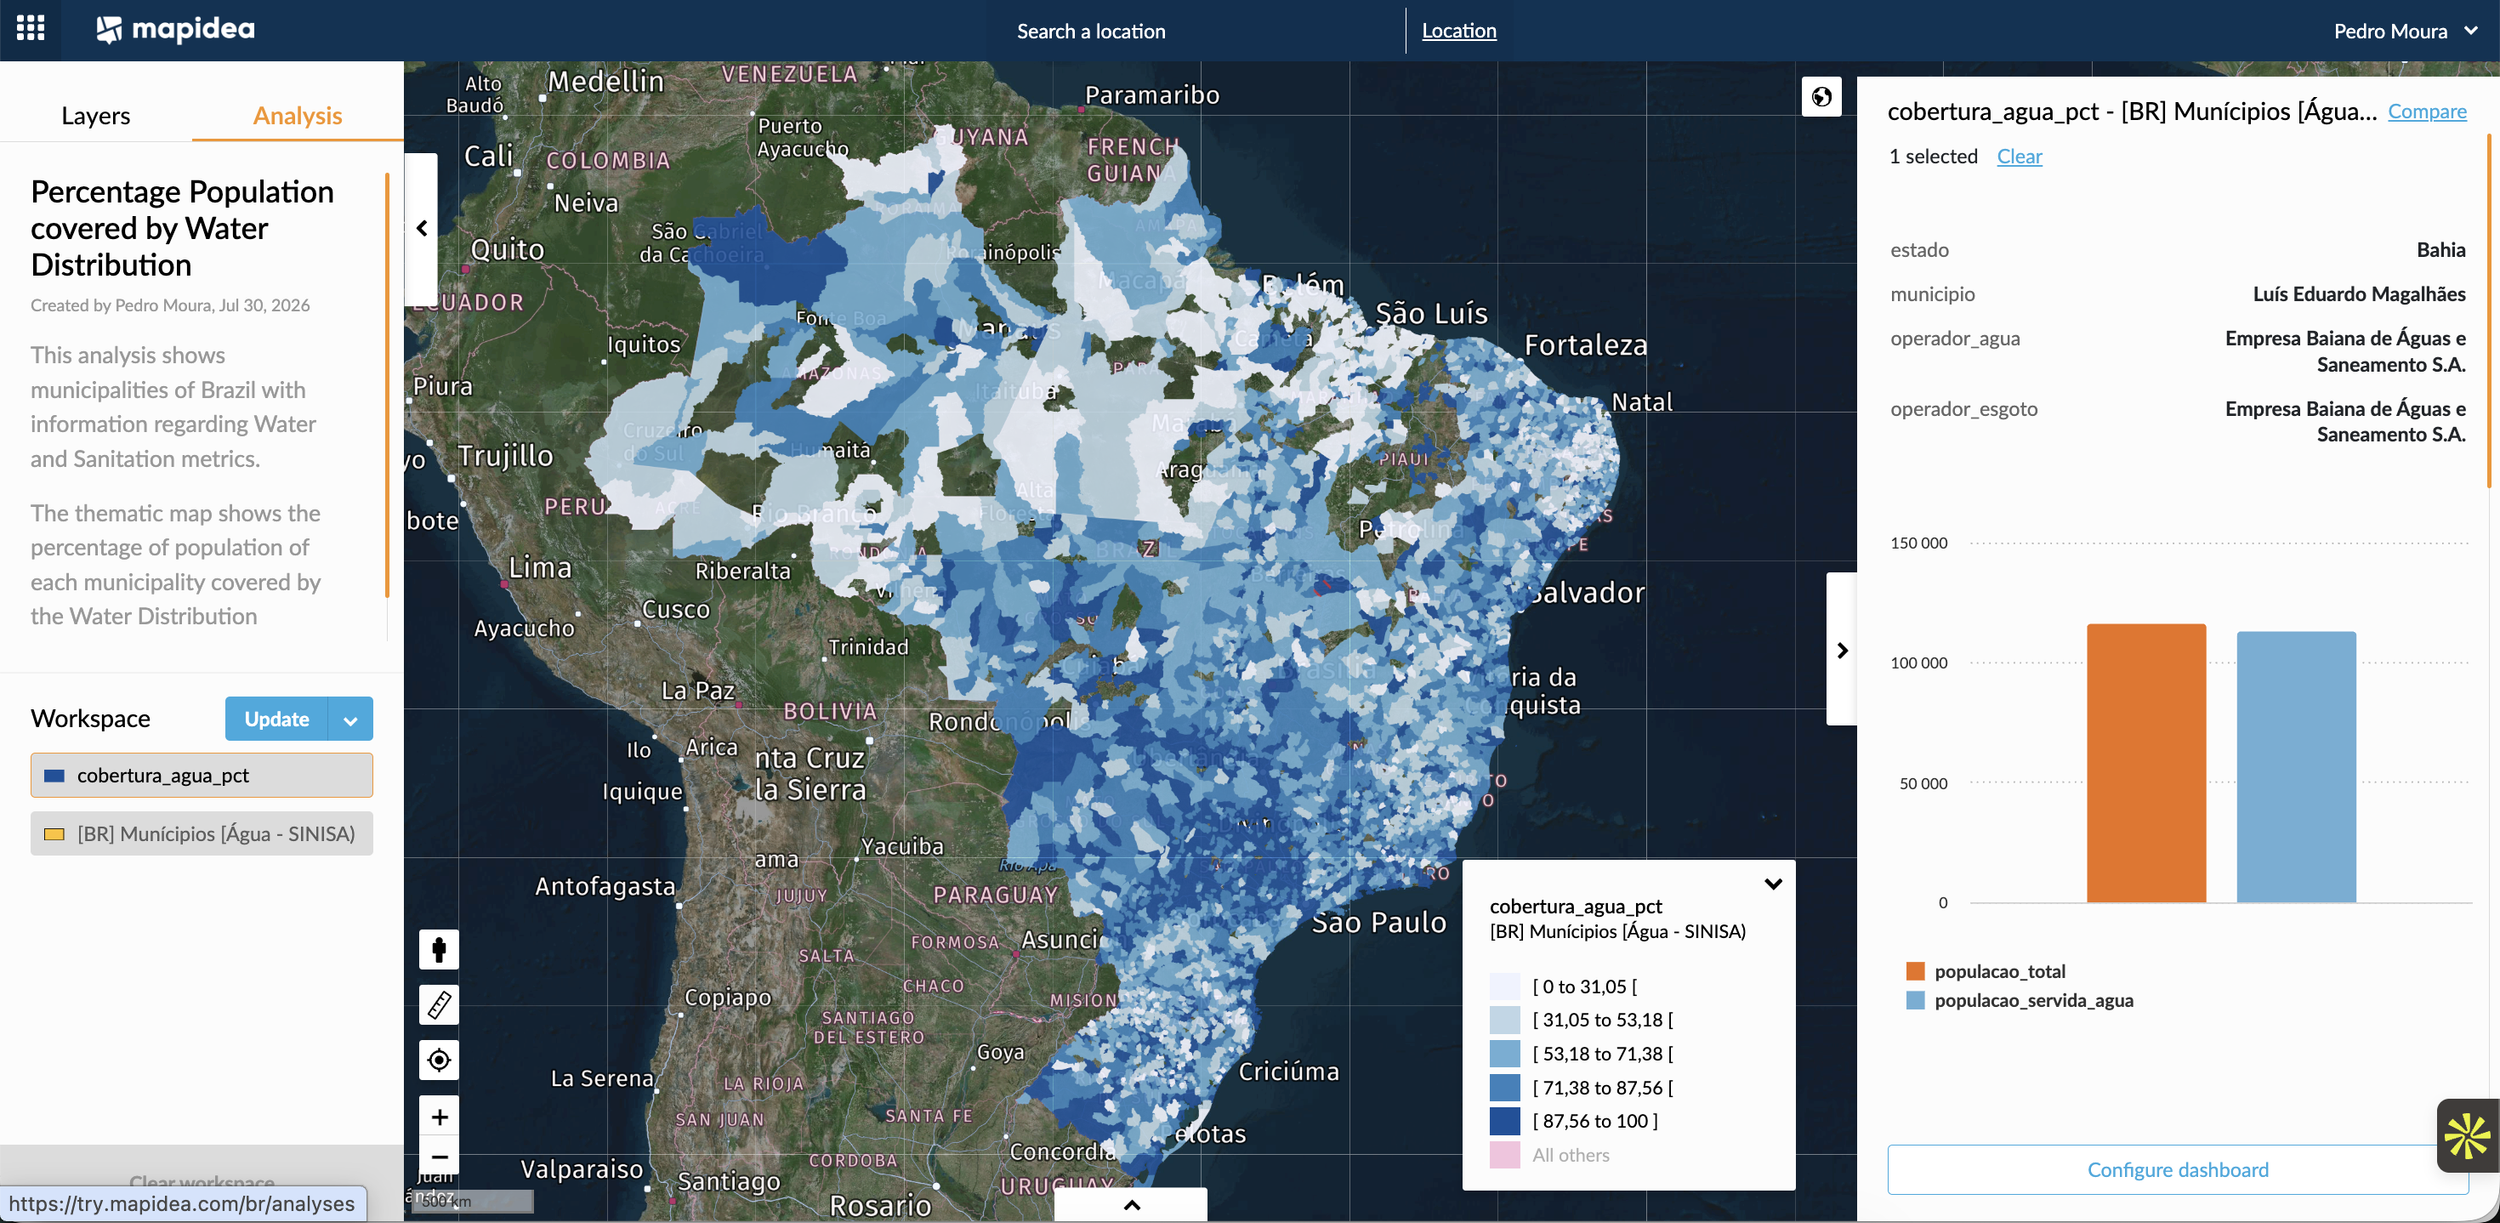
The value of this approach becomes clearer when we consider three analyses at different geographical scales. At national level, water-distribution coverage can be compared across every municipality in Brazil. The percentage of the population served by the network provides a direct view of territorial inequalities and the progress still required towards universal access.
Combined with population growth, urban development, social vulnerability, existing infrastructure and investment estimates, this information can help identify municipalities where network expansion should be investigated and prioritised. Coverage alone does not describe continuity, water quality or service efficiency, but it provides an essential starting point for comparing territories.
A more focused regional analysis can reveal how energy demand varies within a particular market. Across Minas Gerais, electricity consumption per capita can be examined by municipality and related to the number of consumer units, or electricity delivery points, and consumption across residential, commercial, industrial and other customer classes. Temporal information helps distinguish structural differences from recent changes, while the transmission grid and substations provide infrastructure context.
This type of analysis can support market assessment, investment planning, demand monitoring and comparisons between territories. Two municipalities with similar populations may have very different consumption levels, economic profiles and infrastructure requirements.
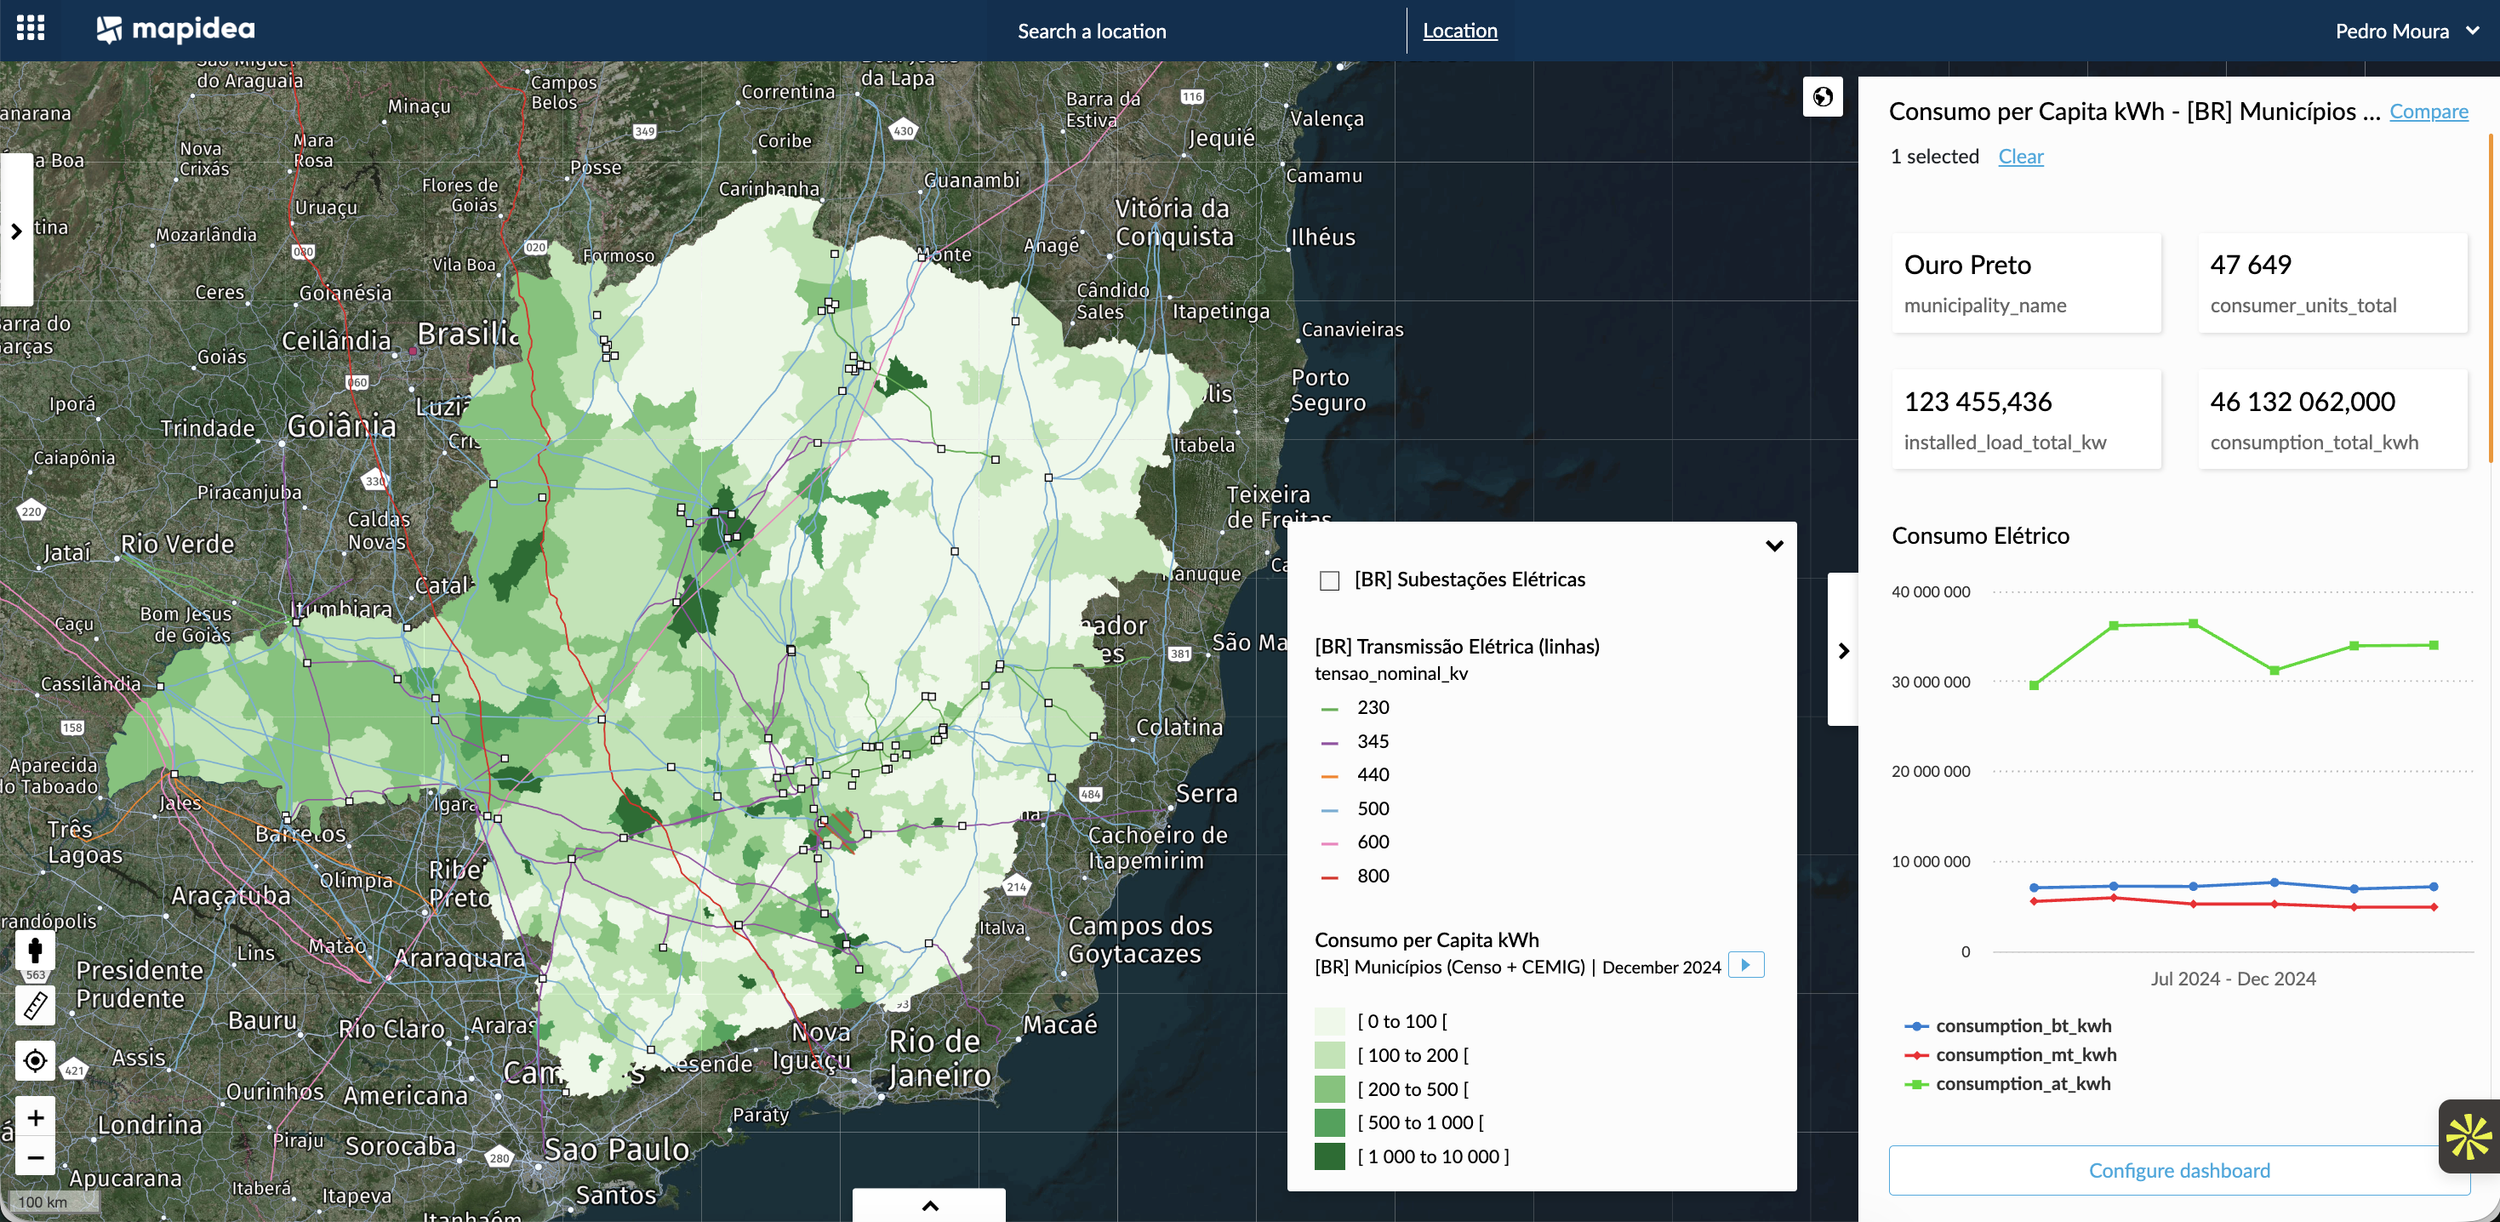
This analysis shows electricity consumption per capita across the municipalities of Minas Gerais. Selecting a municipality provides more information about its number of consumer units and consumption by customer type, including temporal data. The high-level transmission grid and substations are also shown for context and can be explored individually. Source: CEMIG.
At the most detailed level, the analysis can move from municipal indicators to individual consumer units and local low-voltage networks. In Belo Horizonte, consumer units can be categorised by consumer class and analysed in relation to the electricity-distribution network that serves them. This brings the infrastructure and customer dimensions together at neighbourhood and street level.
For technical teams, this provides a basis for understanding how different types of demand are distributed around the network. For business teams, it can support customer acquisition, local segmentation, marketing and sales campaigns, service accessibility analysis and the identification of areas requiring further investigation.
When combined with internal information such as consumption history, interruptions, complaints, work orders and response times, the same geographical foundation can also support service-quality monitoring and more proactive customer communication.
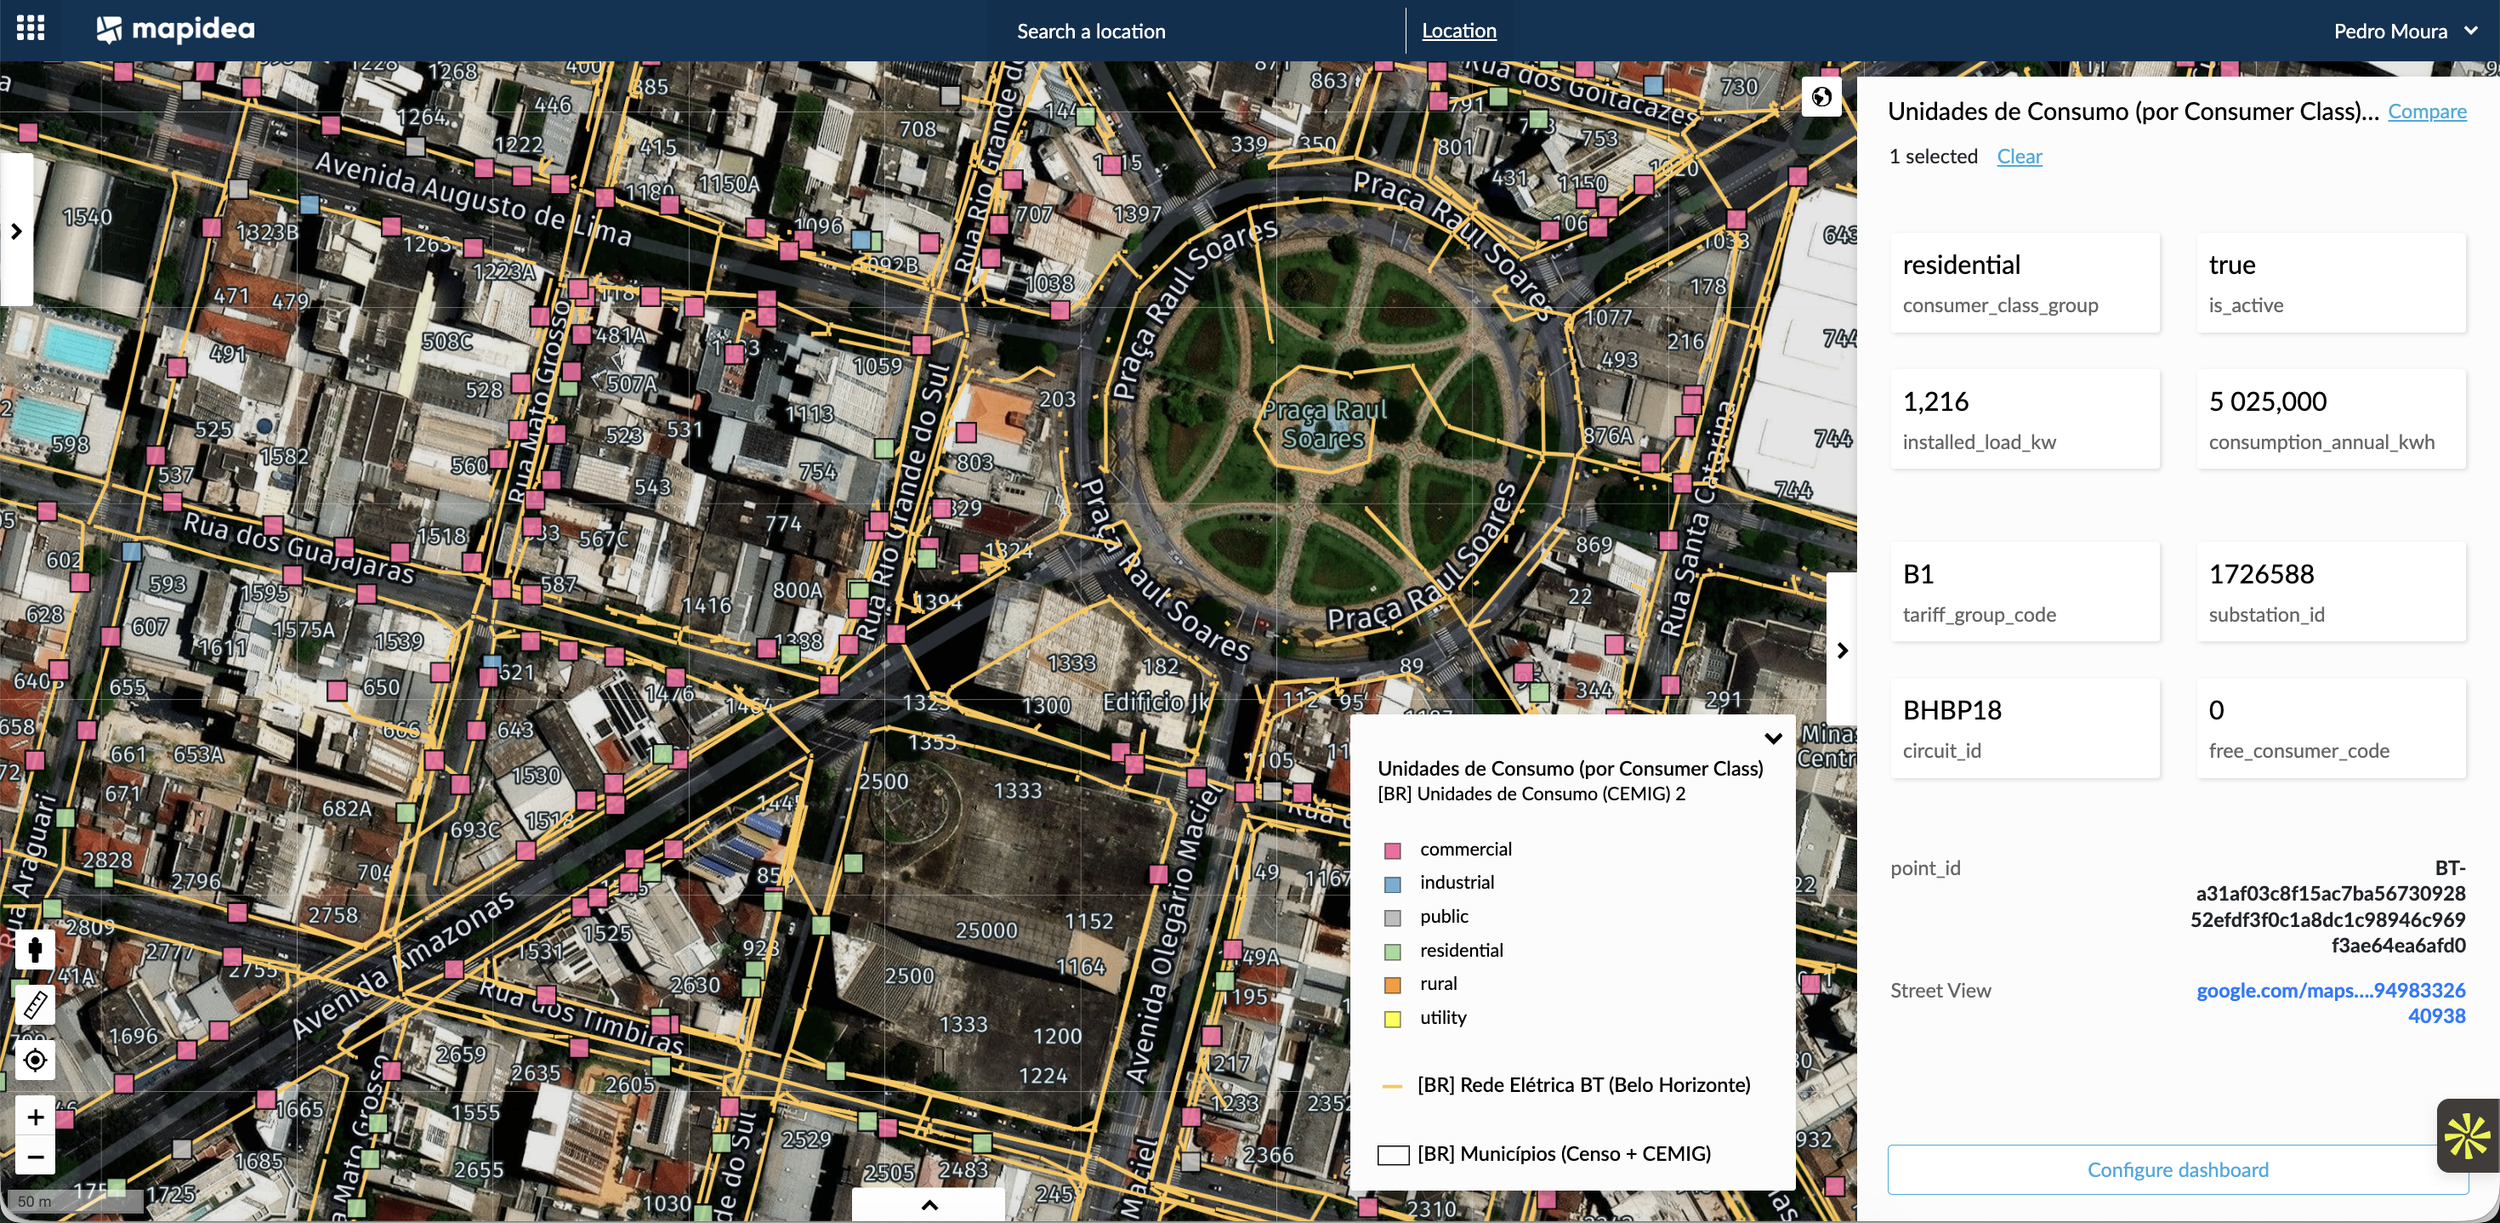
These three examples progress from nationwide comparison to regional market analysis and local action. They also cross the traditional boundary between infrastructure and business information.
The opportunity extends across the utility sector
In electricity, Geographical Intelligence can support grid reinforcement, distributed-generation planning, climate resilience and customer acquisition. It can also help organisations prepare for electric mobility by comparing vehicle adoption, traffic corridors, charging stations, grid proximity and local demand.
The transition to electric vehicles is both an infrastructure challenge and a market transformation. Electricity distributors must understand where new loads may emerge, charging operators need to identify commercially viable locations, and traditional fuel retailers must decide how their existing station networks should evolve.
In water supply, network location is only part of the problem. Consumption, pressure zones, metering, reported leaks, work orders, terrain, building characteristics and urban expansion can be combined to identify where water losses are more likely or where investigation should be prioritised.
Geography is equally relevant to universalisation. Population growth, underserved households, current coverage, terrain, social vulnerability and estimated expansion costs can be analysed together to prioritise water and sanitation investments.
For natural gas, distribution companies can compare existing pipelines and network capacity with industrial facilities, commercial clusters, large buildings and areas dependent on alternative energy sources. This helps identify white spaces, potential anchor customers and viable routes for expansion.
The same approach can support renewable energy, waste management and other territorial infrastructure services. The questions differ, but the principle remains the same: connect the network with the demand, customers, risks and opportunities around it.
Democratising geography requires governance and prepared data
Making Geographical Intelligence accessible does not mean exposing operational systems or sensitive customer information without control.
Different teams require different levels of detail. Commercial users may work with customer segments and aggregated territorial indicators, while engineering teams retain access to asset-level and network-connectivity information. Clear definitions, permissions, aggregation rules and data ownership remain essential.
External data is also fundamental because internal systems cannot describe the full territory. Population, income, businesses, buildings, mobility, vehicle fleets, urban development, renewable potential and environmental risk provide context that a utility does not generate itself. However, this information is often fragmented across agencies and data providers, using different formats, geographic structures and update cycles.
A managed data catalog can transform these sources into documented, analysis-ready layers and combine them with appropriately governed internal data. Business users can then explore territories, analyse service areas, create indicators, compare scenarios and publish dashboards without requesting a new specialist analysis for every question. Self-service does not remove the need for expertise. It allows expert-prepared data and methods to be reused by more people across the organisation.
From an infrastructure system to a shared decision capability
A Geographical Intelligence initiative can begin with a strategic study, an investment assessment or a specific operational challenge. Its greater value emerges when the data, indicators and workflows remain available after the initial project.
A network-expansion study can become an investment-prioritisation cockpit. A market assessment can evolve into a commercial opportunity platform. A water-coverage or loss analysis can become a recurring territorial monitoring process. A climate-risk study can become a continuously updated view of infrastructure exposure.
This business-facing layer does not replace Smallworld, IQGeo, ArcGIS Utility Network, Hexagon, Bentley or other operational platforms. It extends the value of their information by connecting selected infrastructure data with customers, commercial performance, external context and strategic priorities.
That is the broader role of self-service Geographical Intelligence environments such as Mapidea: not to compete with the utility’s operational systems, but to make geography available as a shared analytical dimension across the business.
Utilities have always managed infrastructure geographically. The next challenge is to understand customers, markets, service quality, risk and investment with the same territorial clarity.
If geographical information remains concentrated mainly within engineering and operations, there is probably a much larger business capability still waiting to be unlocked.