
Portugal Has Changed Since the Census. Has Your Market Data Kept Up?
TL;DR: Portugal’s population and demographic composition have changed substantially since the 2021 Census. Organisations using outdated population data risk misjudging markets, locations and investment priorities. Mapidea has transformed the latest official updates into detailed, analysis-ready data for better geographic decisions.
A map can be technically flawless and still support the wrong decision. The locations may be accurate. The calculations may run perfectly. The dashboard may look convincing. But if the population behind the analysis is outdated, the resulting insight can create a dangerous sense of precision.
This is particularly relevant in Portugal today.
The last Census took place in 2021, providing an essential and highly detailed picture of the country at that moment. Since then, however, Portugal has experienced substantial demographic change, driven primarily by strong international migration.
For organisations analysing market potential, planning store or service networks, allocating commercial territories or estimating demand, 2021 is no longer a sufficiently current representation of where people live and who they are.
Portugal has more people than previously estimated
In June 2026, Statistics Portugal, INE, released its resident population estimates for 2025, together with a complete revision of the figures for 2021 to 2024. This was more than a routine annual update. It was the first population estimate produced entirely from administrative data, integrating information from sources such as civil registers, the Tax Authority, Social Security and Portugal’s Agency for Integration, Migration and Asylum.
According to the new estimates, Portugal had 11,424,031 residents at the end of 2025, an increase of almost 825,000 people since 2021. The revision also added more than 637,000 people to the previously published estimate for 2024. In other words, even an organisation working with what appeared to be recent 2024 data could still be using a national population base that materially underestimated the market. The change is not only about the total number of residents. It is also about the composition of the population.
INE now estimates that Portugal had close to 1.6 million residents of foreign nationality in 2025, representing 14% of the population. Between 2021 and 2025, the number of foreign nationals living in the country more than doubled. As the Jornal de Negócios analysis highlighted, the integration of administrative information related to immigration was one of the main reasons for the substantial upward revision.
These are not minor statistical corrections. They describe a different country from the one many organisations still have in their geographic models.
The opportunity cost of outdated data
Population is one of the most common denominators in territorial analysis. It is used to calculate market penetration, sales per resident, service coverage, demand potential, infrastructure capacity and location attractiveness. When that denominator is wrong, the error propagates.
A retailer may underestimate the potential of a catchment area and miss an expansion opportunity. A bank, insurer or telecommunications operator may allocate commercial resources using an outdated view of local demand. A healthcare provider may misjudge the population served by a facility. A real estate investor may evaluate an area without recognising recent demographic pressure. A public organisation may plan services for a population that no longer corresponds to the one living in the territory.
The cost is not limited to choosing the wrong location. It can also mean failing to identify the right location early enough, setting unrealistic performance benchmarks, allocating insufficient capacity or directing marketing investment towards areas whose relative importance has changed.
Population characteristics matter as well. Nationality should not be treated as a substitute for individual behaviour, but the geographic presence of national and foreign populations can be an important market characteristic when combined responsibly with age, household structure, income, spending and an organisation’s own customer data.
It can influence product assortment, communication, service design, channel strategy and the types of demand that businesses should investigate. A total population figure alone cannot provide that insight.
A municipality is often too large to explain a market
The latest official population update is available at municipality level. This is valuable, but municipalities can contain very different local realities.
A municipality may include dense urban neighbourhoods, suburban areas, historic centres, industrial zones and sparsely populated territory. Applying the same population growth rate or demographic profile across the entire municipality conceals those differences. For many business decisions, municipality-level data is simply not detailed enough.
A store does not serve an entire municipality equally. A healthcare facility has a particular catchment area. A sales territory may cover only part of a city. Demand around a transport hub can be very different from demand a few kilometres away.
To make the latest population update useful for this type of analysis, Mapidea created a modelled dataset that brings the new figures to finer geographic levels:
Freguesia, or civil parish
Secção estatística, or statistical section
Subsecção estatística, the most detailed Census geography used in this analysis
The latest official municipal totals are combined with detailed geographic information through a controlled modelling process. This produces a more granular view of the current population while maintaining a clear distinction between official municipal estimates and Mapidea’s modelled small-area figures.
The result is a practical layer for catchment analysis, network planning, territorial segmentation, market potential estimation and comparisons with an organisation’s own customers, sales, stores or service locations.
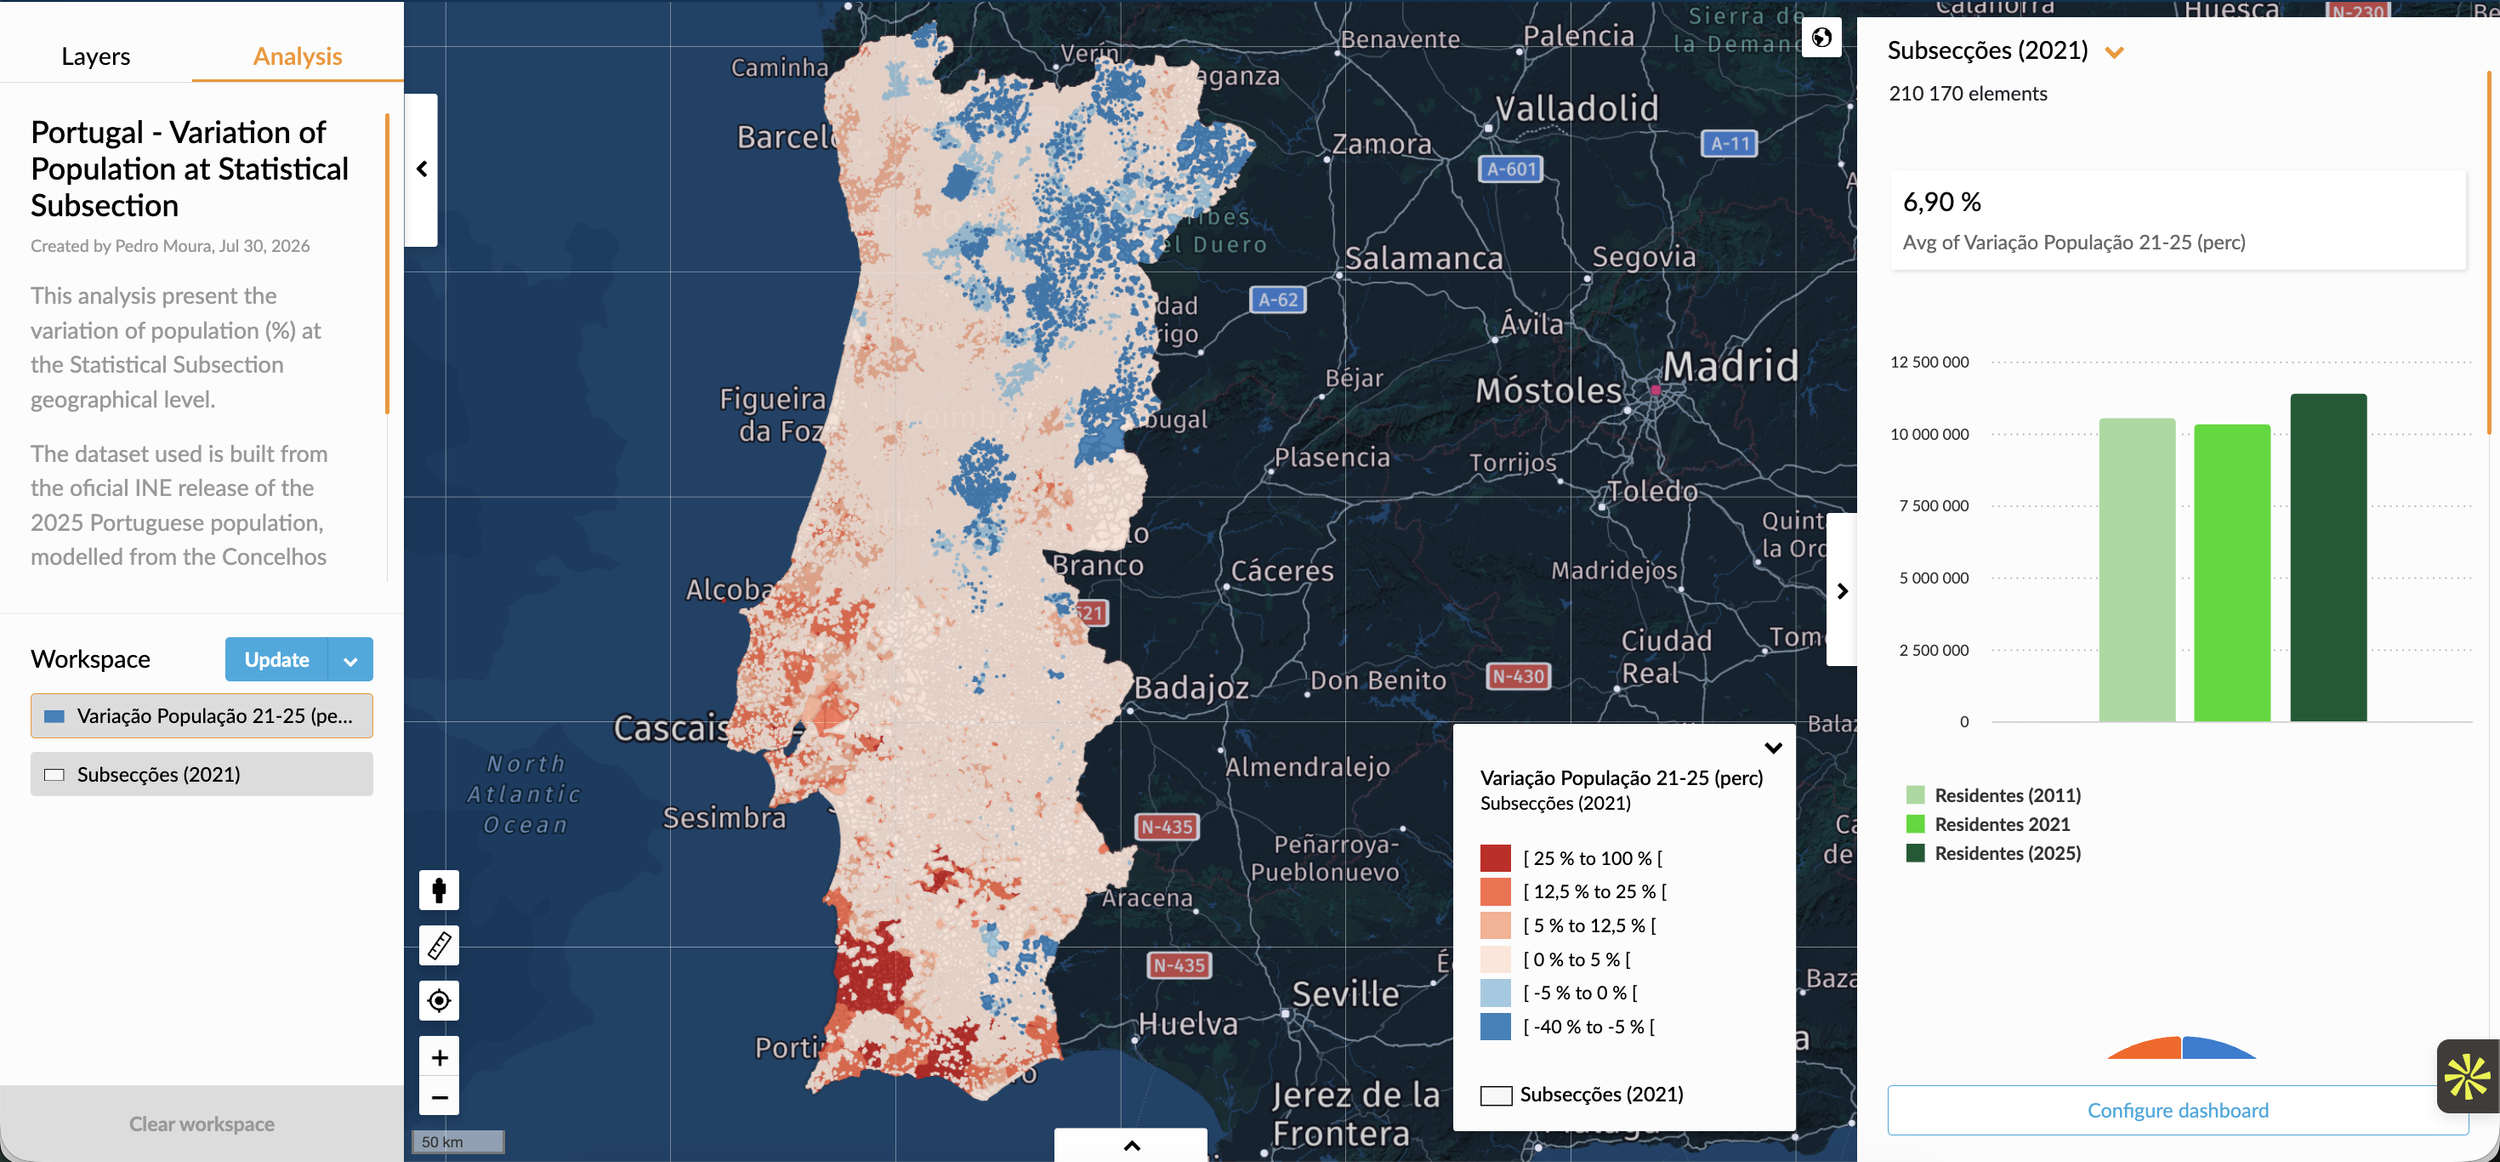
[Live and interactive Mapidea analysis with the new 2025 Population data for Portugal - click image for live report]
Population tells us how many people are there. Economic data tells us more about the opportunity.
Knowing where the population lives is fundamental, but it is rarely sufficient for a business decision. Organisations also need to understand how purchasing power, household income and expenditure vary geographically. Mapidea has therefore complemented the population update with new analysis-ready socioeconomic data.
The latest sources include INE’s 2023 Study on Local Purchasing Power, the recently released 2024 local income statistics, including information derived from anonymised tax data and the number of fiscal households, and the latest Household Expenditure Survey.
These sources answer related but different questions. Purchasing power indicates the relative economic position of each municipality. Fiscal data provides a more recent view of declared income and the number of tax households. Household expenditure data describes how families distribute their spending across different categories. Mapidea brings these sources together to create modelled territorial estimates of household income and spending across a diverse set of product and service categories.
This allows organisations to move from asking only “How many people live here?” to asking more commercially useful questions:
Where is the strongest potential for a particular category? Which areas combine population growth with relevant spending capacity? Where is demand likely to be underestimated by current sales? Which locations have similar population sizes but very different economic profiles?
The reference years and modelling status of the data remain explicit. That transparency is important because an estimate should support decisions without pretending to be a direct observation.
A Location Intelligence platform is only as useful as the data behind it
Geographic analysis tools are important. They make it possible to combine layers, analyse catchments, compare territories, create indicators and communicate insights through maps and dashboards. But software cannot compensate for missing, outdated or poorly prepared data.
This is why the Mapidea Open Data Catalog is a core part of the Mapidea analytical solution. It is not simply a collection of files or links to public portals. It is an ongoing service for identifying, sourcing, validating, standardising, documenting, modelling and updating data so that organisations can actually use it in their analyses.
The catalog provides access to an extensive and continuously growing selection of demographic, socioeconomic, business, mobility, infrastructure, environmental, risk and territorial datasets across the countries where Mapidea clients operate.
Clients can select the information relevant to their markets and business questions, combine it with their own data and make it available to business users directly within Mapidea.
This reduces the time spent searching for sources, interpreting unfamiliar structures, reconciling geographic units and preparing data before any analysis can begin. More importantly, it helps ensure that decisions are based on the best available representation of the territory, rather than on the most convenient dataset already stored somewhere in the organisation.
Review the data before trusting the insight
Portugal’s new population estimates provide a clear lesson: data that was considered current can become materially incomplete when better sources and methods become available. That does not make previous analysis useless. It means organisations need a process for reviewing, updating and documenting the information on which their geographic decisions depend.
If your market potential models, location studies, commercial territories or service planning in Portugal still rely mainly on the 2021 Census, this is a good moment to review their demographic and socioeconomic foundations.
Mapidea can help identify the relevant data, provide analysis-ready layers through its Open Data Catalog and combine them with your organisation’s own information in a practical Location Intelligence environment.
Explore the live analysis, or contact Mapidea to assess whether your current geographic data still reflects the market you are trying to understand.
