
Expanding internationally? Fix your geographic data before it costs you.
TL;DR: Inconsistent geographic data can turn international expansion into expensive guesswork. A harmonised foundation connects market strategy, territory planning and lead generation with ongoing sales monitoring and optimisation. Mapidea helps teams use that evidence together, compare locations and repeat analyses easily—improving speed and accuracy while reducing manual effort and time spent rebuilding reports.
Your expansion strategy has board approval. Local teams have shortlisted markets. Property agents are sending opportunities. Everyone wants to move faster.
Then someone asks whether the locations have actually been compared on the same basis.
One country has detailed population data. Another offers older figures for larger areas. Competitor coverage varies. “High potential” means something different in every presentation. You may be about to commit serious money to a comparison that does not hold up.
The cost starts before you sign a lease: repeated analysis, delayed decisions and teams debating whose spreadsheet to trust. Expand that approach across countries and the inefficiency grows with the business.
Your expansion process needs a foundation that travels.
Consider a fictitious premium skincare brand [KosmetiX] bringing innovative formulas, distinctive textures and refillable packaging to European markets. Customers discover products online, try them in stores and return to replenish. London, Paris and Amsterdam offer an illustrative setting; the analysis is a demonstration, not a ranking of investment opportunities.
The team needs to move from macro strategy to territory planning, lead generation, commercial performance and ongoing sales monitoring and optimisation. Each stage should build on the previous one. Too often, each starts with another data request.
A shared geographic Data Foundation connects those stages. Country-specific sources are organised around common definitions, quality checks and a consistent geographic grid. H3, a system of geographic hexagons, provides that grid across borders and at different levels of detail.
But putting incompatible data into matching hexagons does not make it comparable. Definitions, dates, coverage and scoring rules still need alignment. Missing competitors cannot become “no competition”. Business density can indicate activity, but it is not observed footfall. Premium retail surroundings are a proxy for commercial context, not a direct measure of income or spending.
Agree a comparable core across markets, document the gaps and add richer local evidence where available. That discipline improves the accuracy of comparisons and reduces the effort spent correcting inconsistent assessments later.
Start with where to compete. Then decide where to act.
For the skincare brand, attractiveness should reflect its commercial model: the beauty ecosystem, complementary fashion and lifestyle retailers, competitor intensity, accessibility and convenience for repeat purchases. A discovery destination and a neighbourhood replenishment store may deserve different priorities. The criteria should make those choices explicit.
The first map supports the strategic discussion. At H3 resolution 6 (H6), attractiveness scores provide a broad view across countries, regions and cities. Leadership can identify areas worth investigating and decide where to concentrate expansion resources. Consistent scoring makes the reasoning easier to compare; it does not remove local differences.
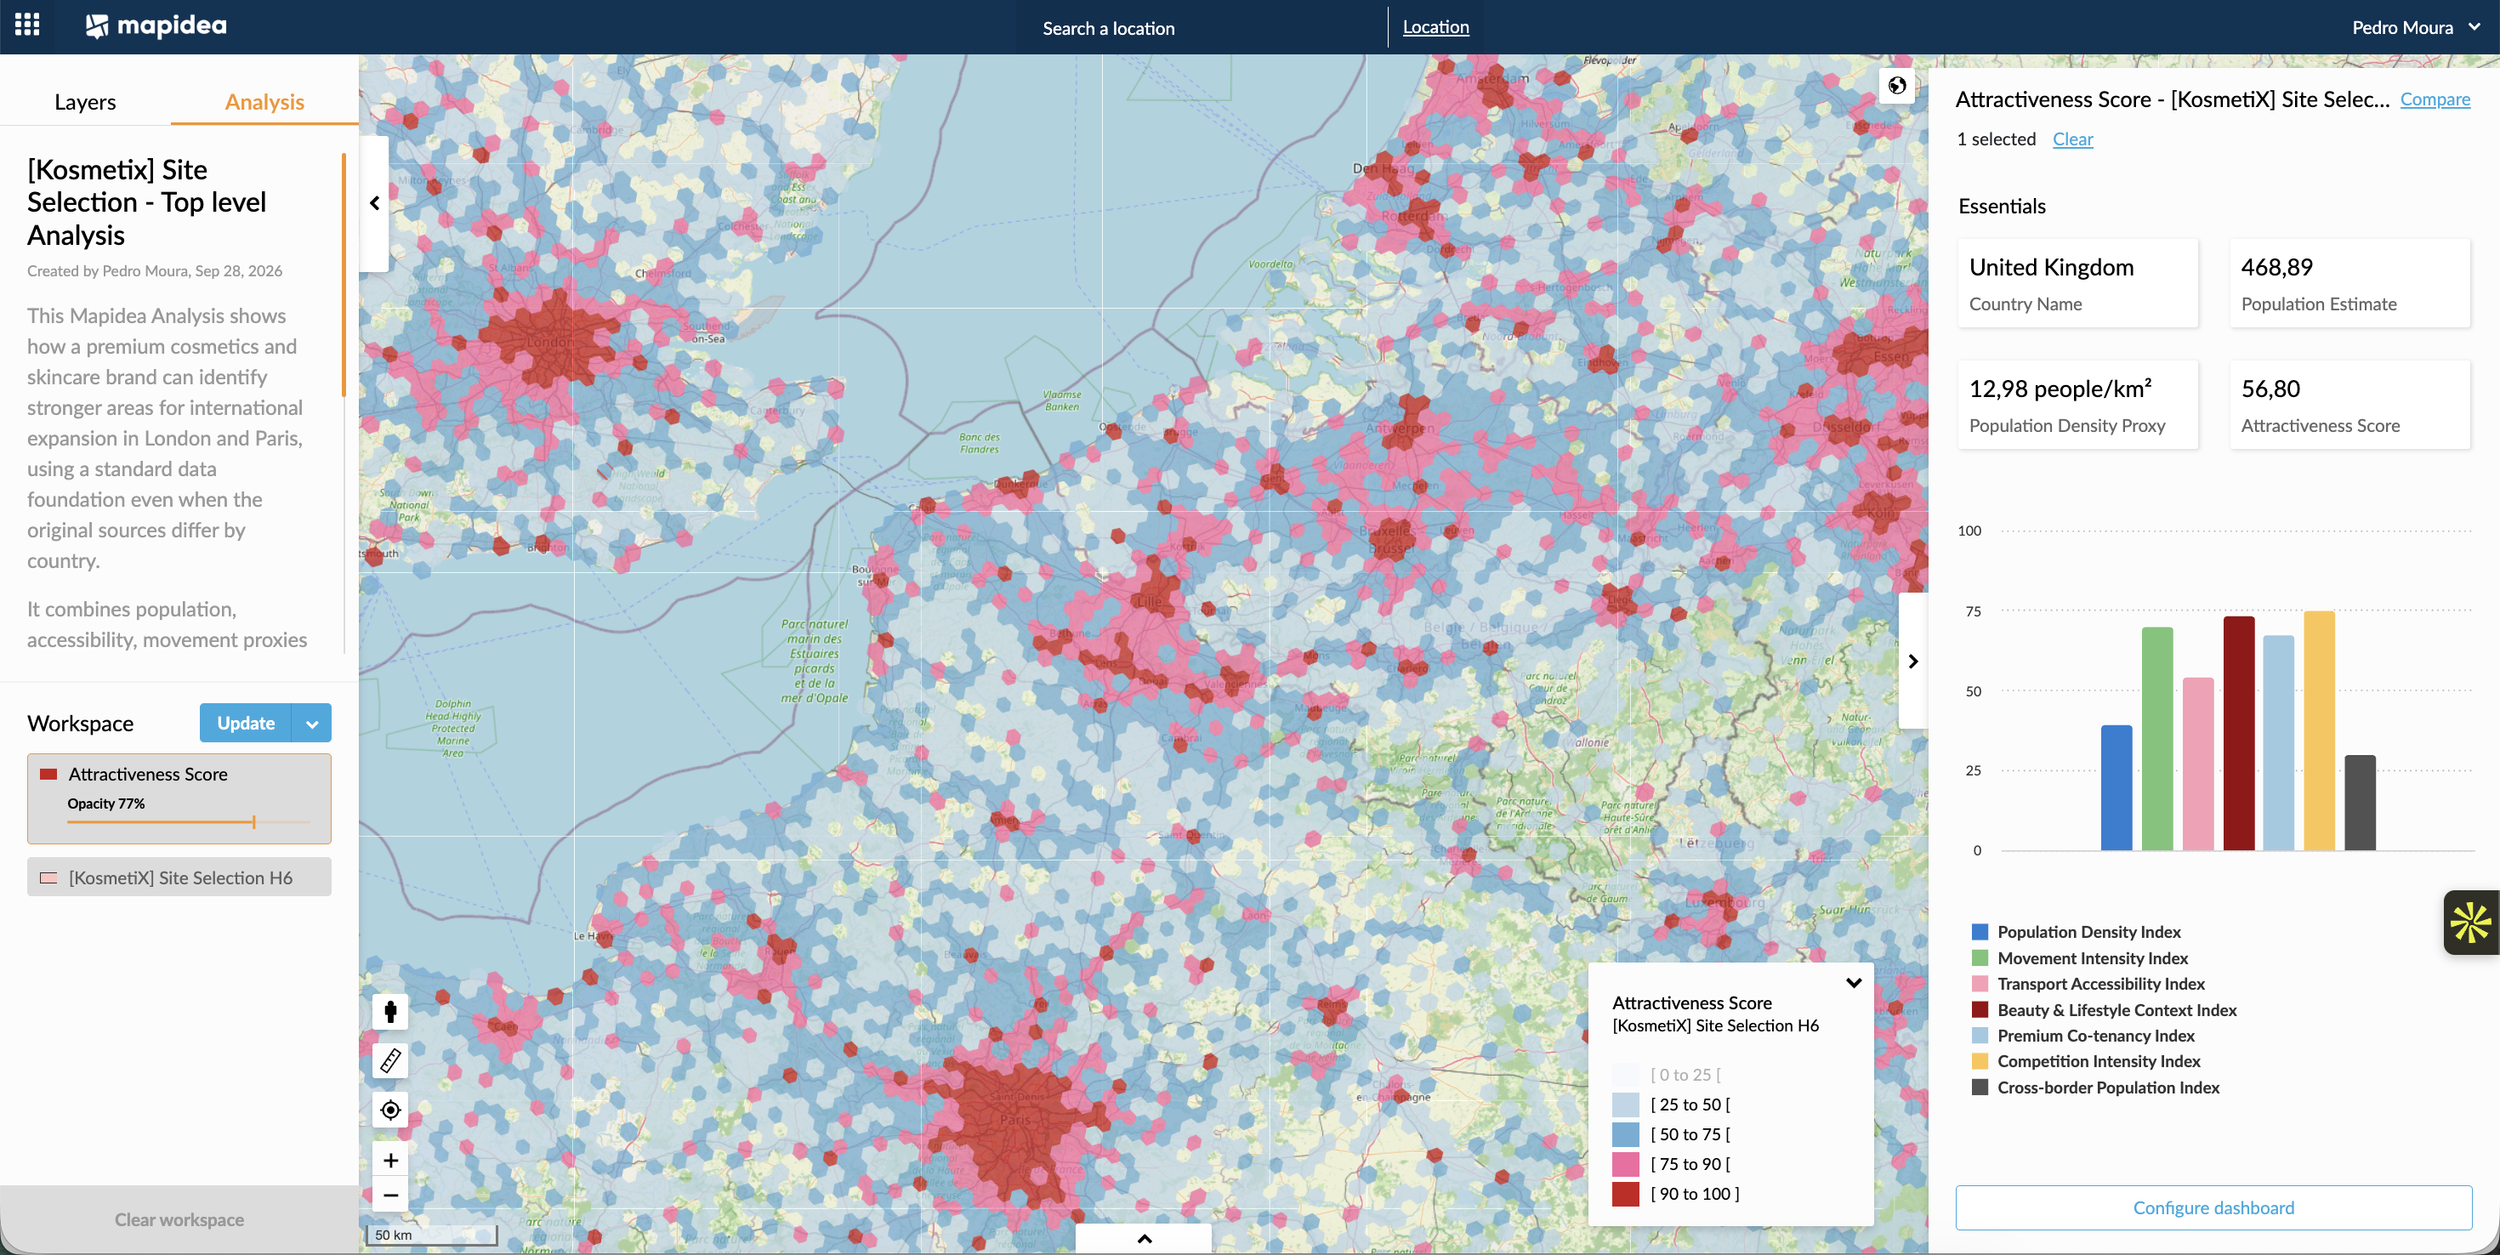
[Image 1] Strategic view: illustrative H6 attractiveness scores support country, region and city prioritisation. - Click for live analysis
Territory planning turns that direction into action: which areas should receive investment, how should coverage develop, and where would a new presence overlap with the existing network? Lead generation then makes the plan concrete, identifying relevant retailers, distributors or other commercial prospects within priority areas. For owned stores, candidate premises enter the same geographic assessment, with availability checked separately.
The second map brings the decision down to city level. A finer H8 attractiveness layer is overlaid with candidate store locations. Each candidate has a configured 10-minute driving isochrone—the area reachable within that travel time—and an average attractiveness score for that area.
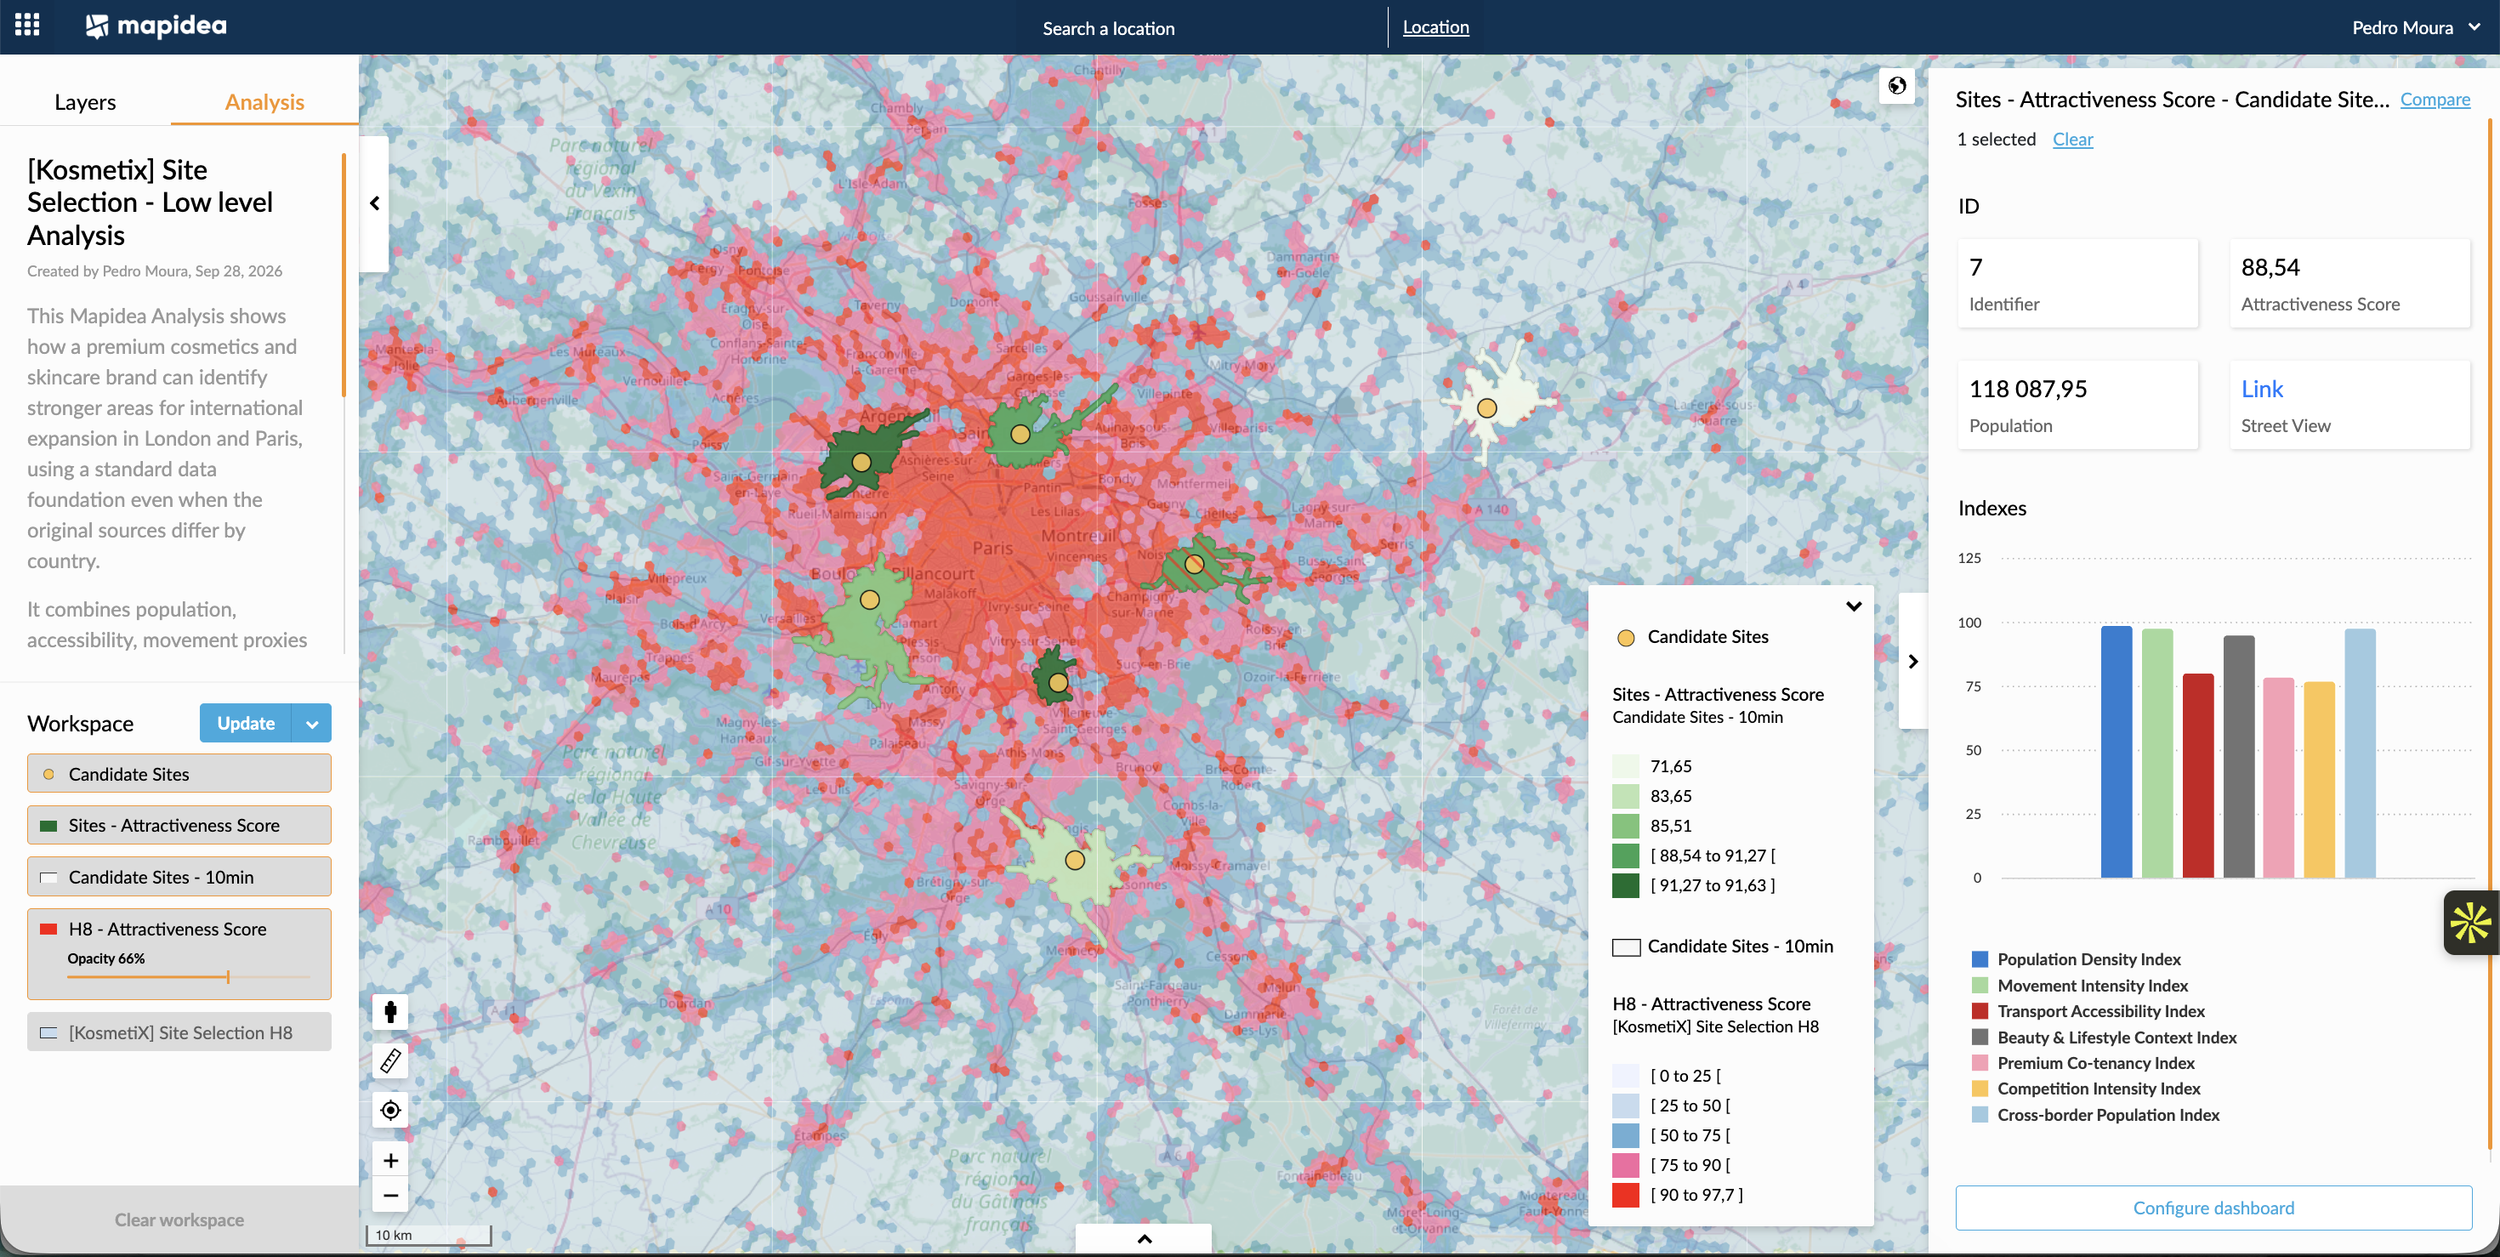
[Image 2] Local comparison: illustrative H8 attractiveness, candidate stores and their 10-minute driving areas, each with an average attractiveness score. - Click for Live Analysis
This lets the team compare the surroundings accessible from each site, inspect overlap and investigate why candidates differ. The driving areas are analytical scenarios, not observed customer catchments; walking or public transport may be more appropriate for some stores. An average score helps prioritise investigation. It does not establish premises availability or forecast revenue.
If every new question needs a technical project, you are moving too slowly.
Once the foundation exists, an expansion manager should be able to assess another candidate without rebuilding the analysis. Mapidea makes that workflow accessible: GeoProcesses apply agreed geographic analyses to one location or a batch and produce consistent reports without requiring business users to write code.
Real estate can bring candidates, marketing can examine the surrounding audience, and sales can challenge coverage assumptions. Working from the same maps and indicators makes collaboration more useful: the discussion centres on trade-offs, with the evidence visible to everyone.
Repeatable analysis reduces manual preparation and time between questions and answers. Transparent definitions and consistent calculations support more accurate decisions. Together, they let teams move faster while keeping assumptions open to scrutiny. Rent, store economics and local validation remain part of the decision.
Opening day is where the next round of evidence begins.
Connect sales and customer data to the same Mapidea foundation, and expansion planning becomes ongoing commercial management. Compare store performance, map customer origins and replace assumed catchments with evidence of where buyers actually come from.
Monitor sales by territory, identify weak penetration, investigate acquisition and churn, and target local marketing. Loyalty and replenishment patterns reveal where repeat purchasing needs attention. Network overlap helps teams investigate cannibalisation and refine the next expansion decision.
The logic extends well beyond beauty. Retailers can compare new stores and optimise coverage. FMCG brands can prioritise markets, generate outlet leads and monitor distribution and sales. Franchise operators can plan territories and assess prospective locations. The indicators change; the need for coherent evidence remains.
Before approving your next expansion wave, ask: can your team move from country selection to a local shortlist—and then to sales monitoring—without rebuilding the evidence at every step?
If the answer is no, your growth plan has a geographic data problem. Fix it before that problem becomes an expensive address.
