Influence Areas: Should You Use Linear Distance or Time-Based Buffers?
When working with location data, defining an influence area is often one of the first analytical steps. Whether you’re evaluating a new store location, optimizing field operations, or analyzing access to public services, your analysis begins with a simple question:
"Which surrounding area matters?"
Two common approaches exist: Linear Distance Buffers and Time-Based Buffers (Isochrones). While both define a "zone of influence" around a point, their assumptions, precision, and use cases differ significantly.
Linear Distance Buffers (Radial Buffers)
Also known as Euclidean Buffers, these represent a circular area around a point based on a fixed distance (e.g., 1 km). They are simple, fast to compute, and easy to interpret. But they make one big assumption: that the surrounding area is equally accessible in all directions.
This approach does not factor:
Street networks
Terrain or physical obstacles
Real travel behavior
Best for:
Radio signal propagation (e.g., cell tower coverage)
Environmental monitoring zones
Catchment estimation in uniform, walkable grids
Time-Based Buffers (Isochrones)
Isochrones define areas reachable within a certain travel time, depending on transportation mode (walking, driving, public transit). These buffers follow the actual road network, accounting for traffic, terrain, bridges, and barriers. As a result, they better reflect reality when movement is involved.
Best for:
Retail catchment analysis
Service accessibility (public & private)
Logistics optimization
Field force territory planning
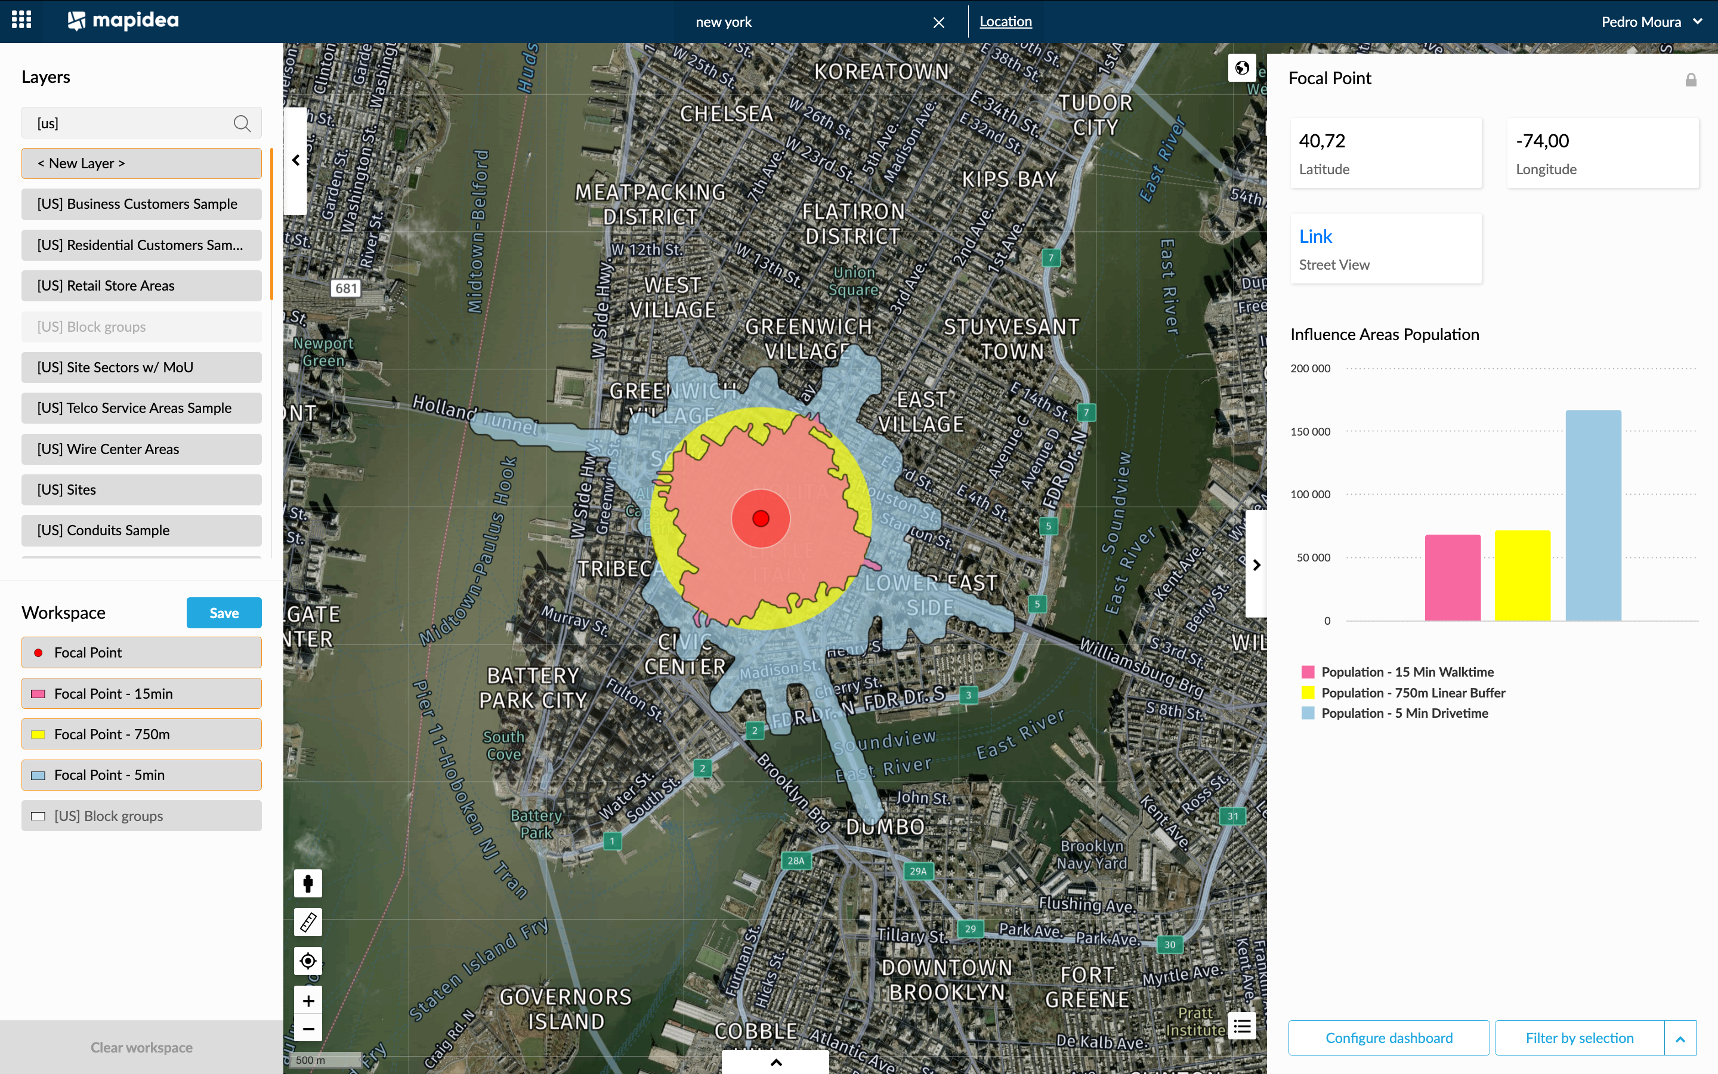
Example of different influence areas: Linear, Walk and Drive time based, each with contained Population calculated (US Census 2021) - Click image for live analysis
Comparing the Two: Real-World Use Cases
Retail
Radial Buffer: A new supermarket plans a 2 km radius to estimate potential customers.
❌ Ignores whether neighborhoods are actually reachable within 2 km (e.g., across a river or major road).
Isochrone: A 10-minute drive-time buffer more realistically models the area people are willing/able to reach the store.
✅ Supports better site selection and campaign targeting.
Telecommunications
Radial Buffer: Essential for network planning, such as estimating LTE signal spread from a cell tower.
✅ Still the right tool here.
Isochrone: Used for customer service areas, e.g., analyzing store access, technician coverage, or optimizing FWA rollout based on population reachable within 20 minutes.
✅ Adds value when analyzing service, not signal.
FMCG & Distribution
Radial Buffer: A brand estimates sales potential based on store density within 3 km.
❌ Doesn't consider how many stores are actually reachable for consumers or delivery vehicles.
Isochrone: Delivery network optimization using 15-minute drive zones from hubs.
✅ Helps balance workload, reduce fuel costs, and improve SLAs.
Government & Public Services
Radial Buffer: Used to check environmental impact zones or regulatory boundaries.
✅ Still appropriate for static, non-movement-driven analysis.
Isochrone: Evaluating accessibility to hospitals, schools, or public transport within walking or driving time.
✅ Essential for equitable planning and funding allocation.
The Trade-Off: Simplicity vs Precision
| Feature | Radial Buffers | Isochrones |
|---|---|---|
| Easy to calculate | ✅ | ❌ (requires network data) |
| Interpretable for non-technical users | ✅ | ✅ (with map context) |
| Suitable for mobility use cases | ❌ | ✅ |
| Accounts for real geography (rivers, highways, hills) | ❌ | ✅ |
| Best for signal/environmental coverage | ✅ | ❌ |
| Best for service access/human behavior | ❌ | ✅ |
So… Which One Should You Use?
Ask yourself: Is movement involved in the analysis?
If yes (humans, vehicles, service teams): use isochrones.
If not (signals, static areas, environmental zones): use radial buffers.
The good news? You don’t have to choose just one. Many analyses benefit from using both, side by side. For example, comparing the population inside a 1 km radius vs within a 10-minute walk can reveal gaps in accessibility that a single method might miss.
Final Thought
In a world where location is central to strategy, relying on outdated, overly simplistic assumptions comes at a cost. Choosing the right type of influence area is not a technical detail—it’s a strategic decision.
Getting it right means better targeting, smarter investments, and more equitable services. Getting it wrong means misallocating resources, misjudging opportunity, or worse—missing it entirely.