
Discover how our new Mexico Population Financials dataset and geographic intelligence solution can help you understand local markets and make better business decisions.
TL;DR: Mexico’s markets vary from one neighbourhood to another. Our new Mexico Population Financials dataset brings local purchasing power and spending patterns into focus, helping organisations make better decisions about expansion, sales, marketing and service delivery. Available through our local partner Mapsmind, the data can be combined with Mapidea, demographic information, points of interest and an organisation’s own data. Reach out to us for more details or access to the dataset.
Mexico’s markets are local. Is your business looking closely enough?
Everything your business does happens somewhere.
Your customers live and work in different places. Your stores and facilities serve different areas. Your competitors are not evenly distributed. Purchasing power and spending patterns change from one neighbourhood to another. And the performance of your business reflects those differences.
So why do so many organisations still make decisions without using geography continuously and across their teams?
A national figure, a state average or even a city-level report can be a useful starting point. But it can also hide the local differences that determine whether a store succeeds, a campaign reaches the right audience, a sales territory performs well or a service is accessible to the people who need it.
The cost of overlooking those differences is real: missed opportunities, investments in less suitable locations, marketing that fails to reflect local markets and business performance that is harder to explain.
A more detailed view of Mexico’s markets
Our new Mexico Population Financials dataset helps organisations understand purchasing power and household spending across Mexico, with spending broken down by COICOP consumption categories.
The data can be analysed at detailed geographic levels, including AGEBs, Munícipios and Estados, making it possible to explore differences within cities and local markets—not just between them.
For example, mapping spending on food can help reveal how this market is distributed across a metropolitan area. Combined with population data, the locations of supermarkets and other relevant points of interest, it can provide valuable context for organisations seeking to understand and serve that market.
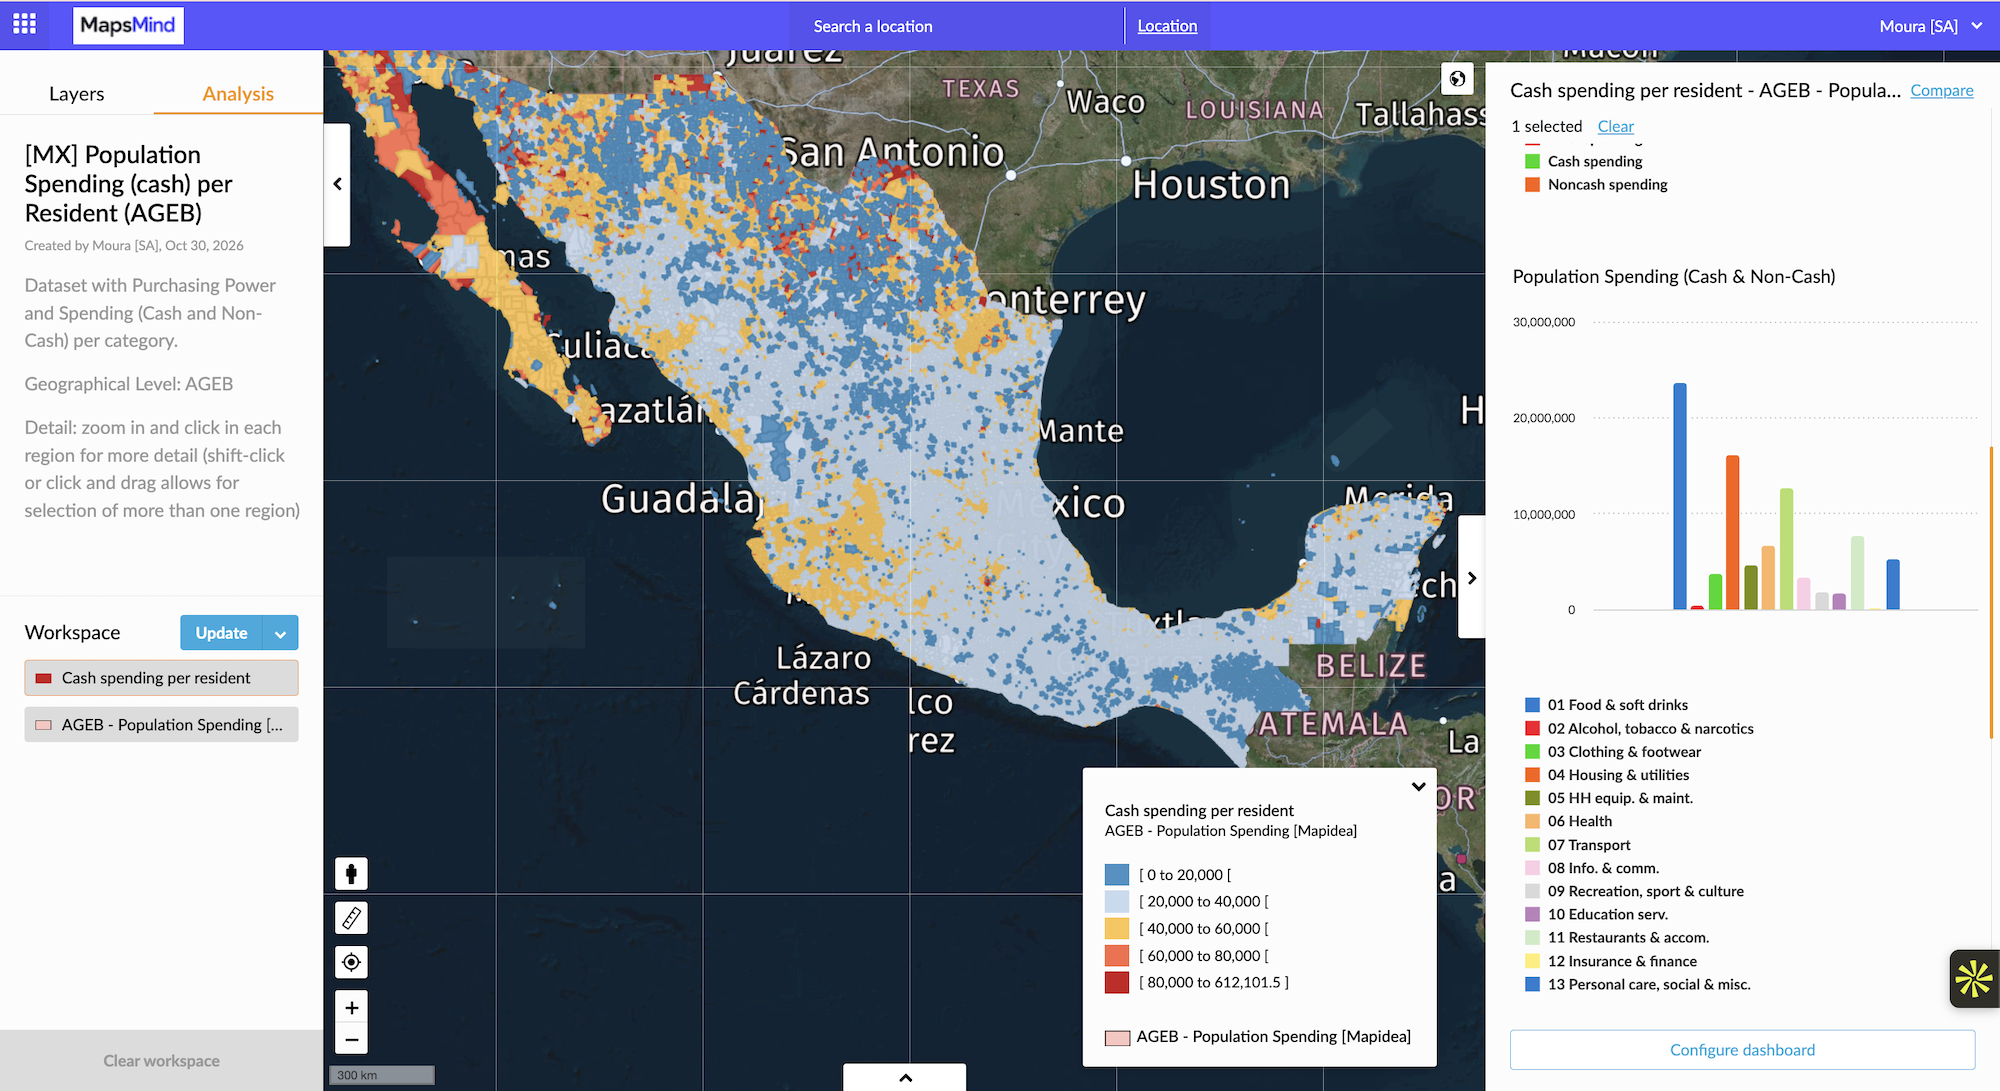
The map is a starting point. The greater value comes from connecting it to the questions a business needs to answer—and bringing in the company’s own data to understand its position within the market.
One geographic foundation, many business decisions
Different industries and teams can use the same geographic foundation to answer very different questions.
| Industry | Business area | Challenge |
|---|---|---|
| Retail and supermarkets | Expansion | Which areas combine attractive spending potential, the right population profile and a suitable competitive environment? |
| Restaurants | Network planning | Where could a new restaurant reach an attractive local market, and how would it fit with the existing network? |
| FMCG | Sales and distribution | Where is category spending significant, but our product distribution or sales are relatively weak? |
| Healthcare | Expansion and marketing | Which areas have relevant healthcare spending and population characteristics, and how are they served by existing facilities? |
| Financial services | Network and customer acquisition | Where should we focus branch, ATM or acquisition efforts based on local population and market characteristics? |
| Telecommunications | Commercial planning | How can we adapt sales priorities and offers to the characteristics of different local markets? |
| Government | Service planning | How do population characteristics and the availability of services vary across the territory, and which areas merit further investigation? |
These decisions require more than a single dataset. Their strength comes from combining relevant market information with the organisation’s own knowledge and data.
Bring the market and your business together
Population Financials can be used alongside a broader portfolio of information, including Census population and household data, the Mapsmind Consumer Index©, a huge diversity of points of interest and other relevant datasets.
In Mapidea, these external datasets can be combined with an organisation’s own locations, customers, sales, territories and operational information. This creates a shared view of both the market and the business—helping teams understand not only where opportunities exist, but also how their organisation is performing against them.
A retailer can compare store performance with local spending potential. An FMCG company can investigate differences between market potential and sales coverage. A healthcare group can assess the communities around its facilities. A financial services provider can explore where its network aligns with the population it aims to serve.
As business data is updated, the geographic view can support ongoing monitoring and decisions across the organisation.
Geography should be part of everyday business
Geographic intelligence should not be limited to specialists or occasional projects. The people responsible for expansion, sales, marketing, operations and strategy should be able to explore their markets and use geographic insight in their regular work.
Mapidea and the Mexico Population Financials dataset are available in Mexico through our local partner Mapsmind, alongside a broader portfolio of demographic, consumer and points-of-interest data.
Your business already has a geography. The question is whether you are using it to make better decisions.
If you would like more details, access to the dataset, or a demonstration of how Mapidea and Mapsmind can support your organisation in Mexico, reach out to us.
